The Website Quality Monitoring Availability Tab is a comprehensive tool that provides you with insights into your website’s uptime and reliability, allowing you to identify and troubleshoot potential issues before they affect your users.
Availability Summary Tab
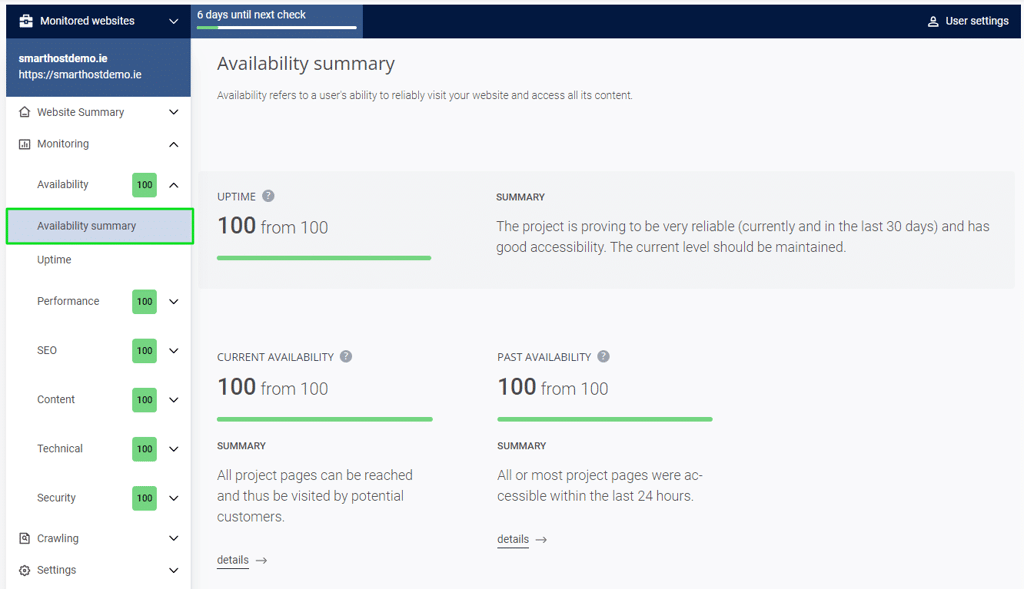
The Availability Summary tab provides a high-level overview of your website’s availability, including:
Uptime
The “Uptime” score in the Monitoring / Availability section of cPanel Site Quality Monitor provides a comprehensive overview of your website’s overall accessibility over a specified period, typically the past 30 days. This score is calculated by dividing the total number of times your website was successfully accessed by the monitoring tool during the specified period by the total number of checks. The resulting percentage represents your website’s uptime percentage.
- A high Uptime score (e.g., 99%) indicates that your website has been accessible for the vast majority of the time during the specified period. This suggests that your website is generally reliable and meets the expectations of your users.
- A low Uptime score (e.g., 90%) indicates that your website has experienced downtime during the specified period. This could be due to various factors, such as server issues, network outages, or software glitches.
By monitoring your website’s Uptime score regularly, you can identify potential uptime issues early on and take corrective action to prevent or minimize downtime. A high Uptime score is crucial for maintaining a positive user experience and ensuring that your website remains accessible to your audience.
Current Availability
The “Current Availability” score in the Monitoring / Availability section of cPanel Site Quality Monitor provides a snapshot of your website’s accessibility at the time of the last check. This score represents the percentage of times your website was successfully accessed by the monitoring tool during the previous interval, typically a few minutes.
- A high Current Availability score (e.g., 99%) indicates that your website was accessible almost all the time during the last check. This suggests that your website is generally reliable and can meet the needs of your users.
- However, a low Current Availability score (e.g., 50%) indicates that there were significant periods during the last check when your website was not accessible. This could indicate potential issues with your website’s server, network, or software.
By monitoring your website’s Current Availability score regularly, you can identify potential uptime issues early on and take corrective action before they affect your users.
Past Availability
The “Past Availability” score in the Monitoring / Availability section of cPanel Site Quality Monitor provides a historical view of your website’s uptime performance over the past 24 hours. This score is calculated by averaging the Current Availability scores for each check performed during the previous day.
- A high Past Availability score (e.g., 98%) indicates that your website has been consistently accessible throughout the past 24 hours. This suggests that your website has experienced minimal downtime and is generally reliable.
- A low Past Availability score (e.g., 90%) indicates that your website has experienced downtime during the past 24 hours. This could be due to various factors, such as server issues, network outages, or software glitches.
By monitoring your website’s Past Availability score regularly, you can identify trends in your website’s uptime performance and proactively address potential issues before they affect your users. A high Past Availability score is essential for maintaining a consistent user experience and ensuring that your website remains accessible over time.
Uptime Tab
The Uptime tab delves deeper into the availability of specific URLs on your website, providing detailed information for each URL:
- URL: Displays the URL being monitored.
- Screenshot: A recent screenshot of the URL’s content.
- Uptime Percentage: The current uptime percentage for the URL, indicating how consistently it is accessible.
- Error Status: Indicates whether any uptime failures have occurred for the URL.
- Line Graph: Provides a visual representation of the URL’s uptime history, allowing you to track trends over time.
Uptime Settings Tab
The Uptime Settings tab allows you to customize the Site Quality Monitoring feature’s handling of uptime errors:
- Error Sensitivity: Adjust the number of consecutive uptime failures required to trigger an error notification. Choose from three options:
- High: Report an error for every uptime failure.
- Moderate: Report an error after two consecutive uptime failures.
- Low: Report an error after three consecutive uptime failures.
By actively monitoring your website’s availability through the Availability Summary and Uptime tabs, you can proactively identify and address potential issues, ensuring that your website remains accessible to users without disruptions.
FAQ: Monitoring / Availability Section in cPanel Site Quality Monitor
The Monitoring / Availability section is a tool that provides insights into your website’s uptime and reliability. It helps you identify and troubleshoot potential issues before they affect your users.
The Availability Summary tab provides a high-level overview of your website’s uptime, including your website’s overall uptime percentage, current availability, and past availability.
The Uptime tab provides detailed information about the uptime of specific URLs on your website. This information includes the URL, a screenshot of the URL’s content, the uptime percentage, the error status, and a line graph of the URL’s uptime history.
The Error Sensitivity setting determines how many consecutive uptime failures are required to trigger an error notification. You can choose from three options: High, Moderate, and Low. High will report an error for every uptime failure, Moderate will report an error after two consecutive uptime failures, and Low will report an error after three consecutive uptime failures.
By regularly monitoring your website’s uptime and addressing any issues that arise, you can help to prevent downtime and ensure that your website is available to your users at all times.
By using the Monitoring / Availability section, you can:
1. Proactively identify and troubleshoot uptime issues
2. Improve your website’s overall uptime
3. Enhance user experience
4. Maintain a positive online reputation
Yes, the Monitoring / Availability section is designed to be user-friendly and easy to understand. You do not need to be a technical expert to use the tool.
