The Monitoring / Performance section in cPanel Site Quality Monitor provides insights into your website’s loading speed and responsiveness, helping you identify and address potential performance bottlenecks that may negatively impact user experience.
The Performance tab on Site Quality Monitor offers a comprehensive view of your website’s performance across various aspects, including:
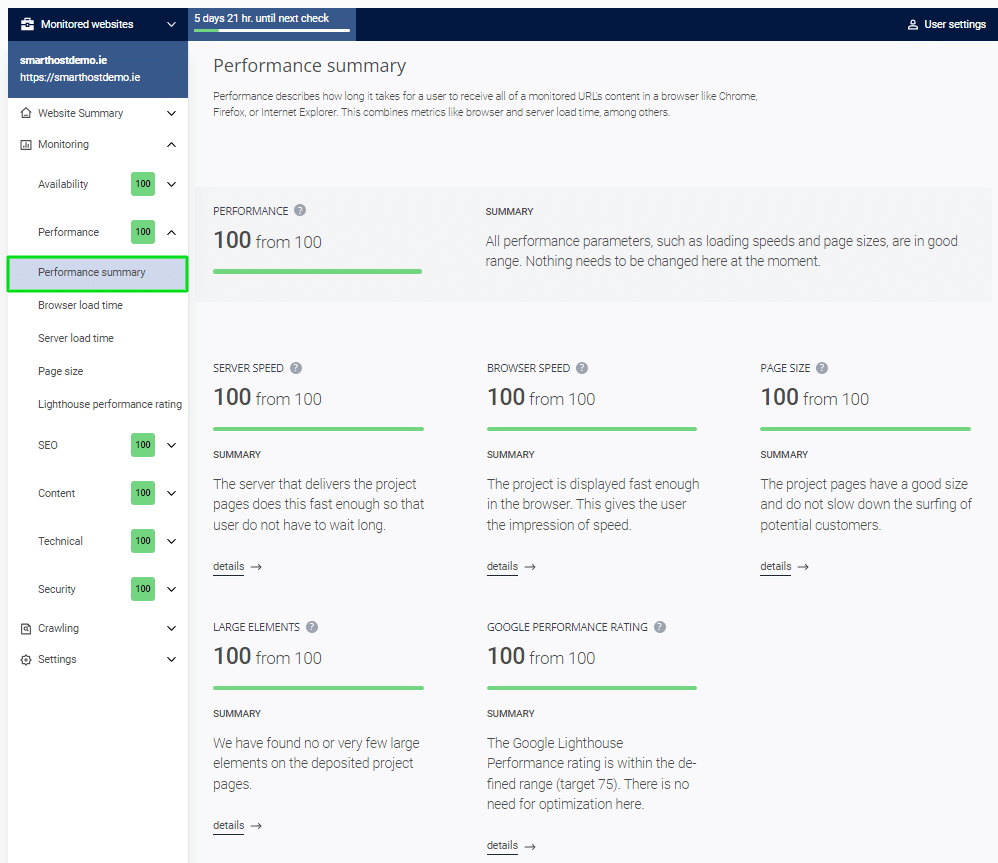
The Performance Summary tab presents a comprehensive overview of your website’s performance, with scores for various aspects of its performance capabilities. Each score is accompanied by a colour indicator bar that indicates its status. If a check category allows, you can click “Details” to view the results of checks made in that specific category for your individual monitored URLs.
| Score | Description |
|---|---|
| Performance | This score summarises your website’s oversized element checks. |
| Server speed | This score summarises your website’s server speed. |
| Browser speed | This score summarises your website’s browser load time. |
| Page size | This score summarises your website’s page size efficiency. |
| Large elements | This score summarises your website’s oversize element checks. |
| Google performance rating | This score summarises your website’s Lighthouse performance checks. |
Performance
The Performance score provides an overall assessment of your website’s performance capabilities. It considers various factors that contribute to your website’s speed and responsiveness, such as server response times, browser load times, and page size efficiency. A high performance score indicates that your website is loading quickly and efficiently, while a lower score suggests areas for improvement.
Server speed
Server speed measures the time it takes for your website’s server to deliver resources to web browsers. A fast server speed ensures that your website’s content loads quickly for users, while a slow server speed can lead to frustratingly slow loading times. A high Server speed score reflects a responsive and efficient server, while a lower score may indicate a need to optimise your server configuration or upgrade your hosting plan.
Browser speed
Browser speed assesses the time it takes for your website’s content to load in a web browser. It considers factors such as the size of your website’s files, the use of efficient coding techniques, and the browser’s own processing capabilities. A high Browser speed score indicates that your website is loading quickly in most browsers, while a lower score may reveal areas where you can optimise your code or reduce the size of your files.
Page size
Page size evaluates the overall size of your website’s HTML, CSS, and JavaScript files. A large page size can impact loading times and affect the user experience. A high Page size score suggests that your website might benefit from minifying your code and compressing your images to reduce its file size.
Large elements
Large elements identify and assess any oversized elements on your website that may significantly impact loading times. Oversized elements can include large images, embedded videos, or unnecessary code blocks. A high Large elements score indicates potential bottlenecks in your website’s loading process. By identifying and optimising these elements, you can improve your website’s overall performance.
Google performance rating
The Google performance rating evaluates your website’s performance based on Lighthouse performance metrics, which assess various aspects of your website’s speed, usability, and accessibility. A high Google performance rating reflects a well-optimised website that meets Google’s performance standards.
FAQ: Monitoring / Performance Section in cPanel Site Quality Monitor
The Performance tab is a tool that provides you with a comprehensive overview of your website’s performance, including scores for various aspects of its performance capabilities. It also allows you to identify and address potential performance issues that may be affecting your website’s speed, responsiveness, and user experience.
The Performance tab reports on six different performance categories:
– Performance: This score summarises your website’s overall performance capability.
– Server speed: This score summarises your website’s server speed.
– Browser speed: This score summarises your website’s browser load time.
– Page size: This score summarises your website’s page size efficiency.
– Large elements: This score summarises your website’s oversized element checks.
– Google performance rating: This score summarises your website’s Lighthouse performance checks.
The colour indicators in the Performance tab provide a quick visual representation of your website’s performance in each category. Green indicates good performance, yellow indicates moderate performance, and red indicates poor performance.
The “Pages with hints” lists in the Performance tab identify specific URLs on your website that have performance issues in the corresponding category. Hovering over a URL in these lists will provide a hint about the performance issue.
The Performance tab provides valuable insights into your website’s performance and can help you identify areas where you can improve. You can use the information provided in the tab to:
– Optimise your website’s code: This may include minifying your HTML, CSS, and JavaScript files, and using efficient coding techniques.
– Reduce the size of your website’s files: This may include compressing your images and using lazy loading techniques to load images only when they are visible on the screen.
– Optimise your server settings: This may include upgrading your hosting plan or adjusting your server configuration.
– Address any oversized elements: This may involve reducing the size of large images or embedded videos.
It is recommended to review the Performance tab regularly to monitor your website’s performance and identify any potential issues.
There are many resources available online that can help you improve your website’s performance. Some popular resources include:
Google PageSpeed Insights: https://developers.google.com/speed/pagespeed/insights/
YSlow: http://yslow.org/
GTmetrix: https://gtmetrix.com/
WebPageTest: https://webpagetest.org/
